

Virtual Try-On vs Size Charts: 10.5x Better Conversion
Virtual try-on vs size charts: VTO achieves 10.5x higher purchase rates and 25-40% lower returns. Learn why 71% of shoppers demand AR fitting, and how wardrobe integration closes the gap.
 Mehul AgarwalFounder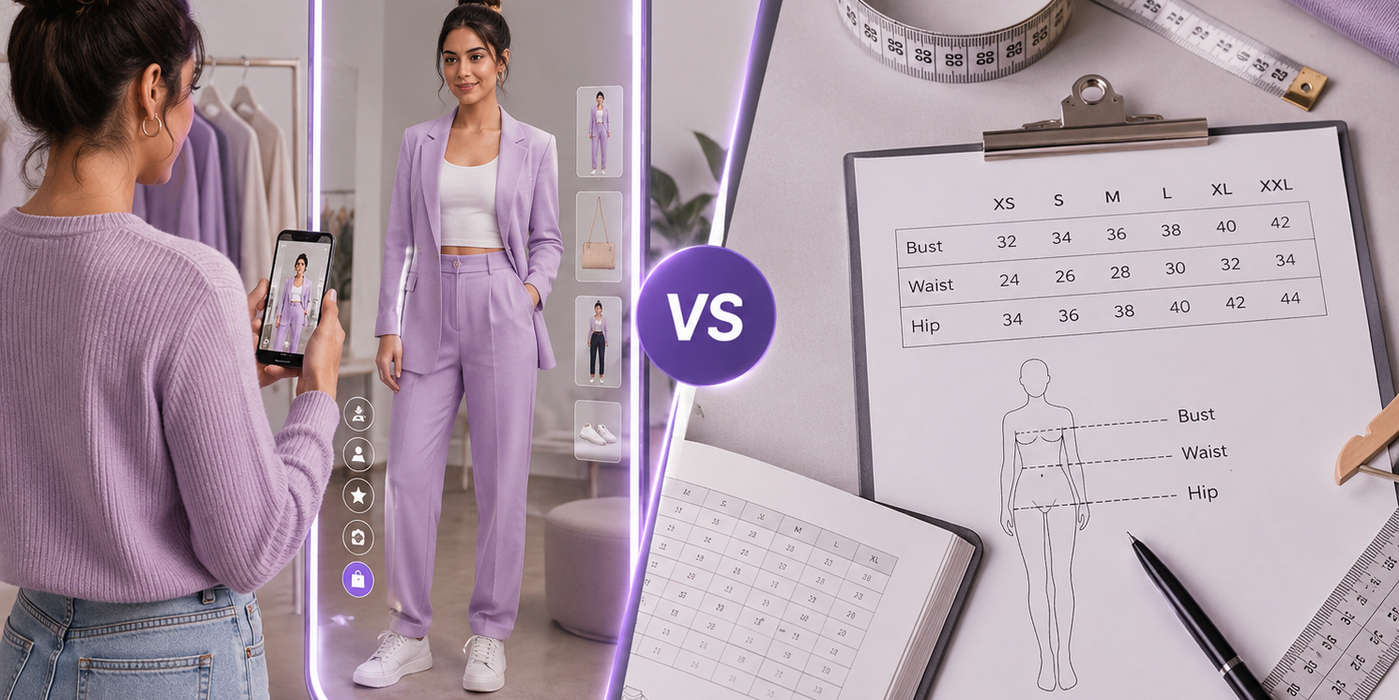
AI Virtual Try-On vs Size Charts
Table of Contents
- Introduction: The Fitting Room Problem No One Has Solved
- Why Size Charts Fall Short: The 42% Problem
- How Virtual Try-On Rewrites the Conversion Equation
- The Adoption Paradox: 71% Demand, 1% Supply
- Wardrobe Context: The Layer That Makes VTO Exponentially More Powerful
- Head-to-Head: VTO vs. Size Charts Across Key Metrics
- Frequently Asked Questions
- TL;DR Summary
- Conclusion: From Comparison to Confidence Layer
Key Takeaways
- Shoppers using virtual try-on are 10.5x more likely to purchase than those relying on size charts alone
- VTO reduces return rates by 25–40%; size charts achieve only 5–10%
- Size charts carry a 42% fit accuracy rate—a structural flaw, not a user error
- 71% of consumers demand AR try-on, yet only ~1% of stores offer it
- Wardrobe-integrated VTO goes further than standalone tools—answering not just "does this fit?" but "does this work with what I own?"
Introduction: The Fitting Room Problem No One Has Solved
Shoppers who use virtual try-on are 10.5 times more likely to make a purchase than those relying on size charts alone—according to data corroborated across multiple industry sources including Looksy and Morphed. That's not a marginal improvement. That's the difference between a tool that nudges and a tool that converts.
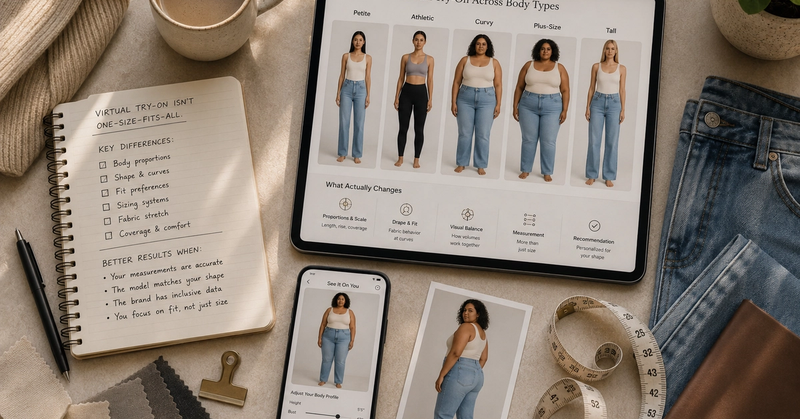
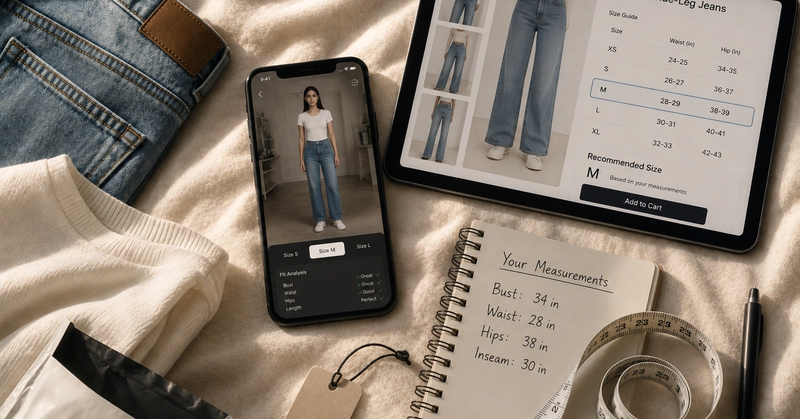
The two approaches couldn't be more structurally different. Size charts are static and measurement-based: they ask shoppers to self-measure, locate themselves on a brand-specific grid, and mentally project how a garment will look and feel. Virtual try-on (VTO) is dynamic, visual, and interactive—it places a digital rendering of the item on a body in real time, collapsing the gap between imagination and reality.
You've probably lived the size chart failure yourself: you measured carefully, ordered the recommended size, and still returned the package. That experience is the norm, not the exception.
What makes the current moment particularly striking is the adoption gap. According to Morphed and ProductTryOn, 71% of consumers actively want AR try-on capability when shopping online—yet only approximately 1% of e-commerce stores currently offer it. That gap between demand and supply is the central tension this article unpacks.
By the end, you'll understand not just which tool wins the head-to-head, but why the real competitive edge belongs to a wardrobe-integrated approach—one that answers a question neither size charts nor standalone VTO can fully resolve.
Why Size Charts Fall Short: The 42% Problem
Size charts have a 42% success rate for accurate fit prediction—meaning they get it wrong more than half the time, according to data from Looksy and Antla. That figure isn't a commentary on careless shoppers. It's a structural indictment of the tool itself.
Here's why the failure is baked in: size charts require shoppers to complete a multi-step task without any visual feedback. First, self-measure accurately (most people don't own a tailor's tape). Second, locate those measurements on a brand-specific grid that varies significantly from one label to the next—a medium at one brand is a large at another. Third, mentally visualize how those numbers translate into drape, fit, and proportion on their specific body. Each step introduces error. The final step is essentially impossible to do reliably.
The downstream consequence shows up in returns data. Size charts alone reduce return rates by just 5–10%, according to Drezzly and Looksy. Virtual try-on, by contrast, reduces returns by 25–40%. That's not a comparable range—it's a categorical difference. Size charts trim the edges of the return problem; VTO addresses its root cause.
The psychological failure is equally important to understand. Size charts translate a body into abstract numbers, then ask shoppers to work backward from those numbers to a visual outcome. That process generates uncertainty, not confidence. A shopper who "knows" they're a size 12 with a 36-inch bust still has no idea whether this particular dress will hit at the knee or mid-thigh, whether the shoulders will pull, or whether the fabric will skim or cling. The number answers none of those questions.
That said, size charts aren't without legitimate use cases. For retailers operating in low-bandwidth environments or serving users who rely on screen readers, a well-structured size chart remains accessible where VTO is not. For highly standardized product categories—athletic socks, basic tees with consistent construction—the fit variables are narrow enough that measurement grids perform adequately. And for very small retailers without the budget or technical infrastructure for VTO integration, size charts remain a cost-free baseline. The problem isn't that size charts exist—it's that the industry has treated them as a sufficient solution to a problem they were never designed to fully solve. They're a legacy tool still doing primary duty in 2026.
How Virtual Try-On Rewrites the Conversion Equation
That framing—size charts as a legacy tool still doing primary duty in 2026—makes the performance data on virtual try-on even more striking. The gap between the two approaches isn't marginal. It's structural.
Shoppers using virtual try-on are 10.5 times more likely to make a purchase than those relying on size charts alone, according to data corroborated across multiple industry sources including Looksy and Morphed. Pair that with a 20–35% conversion rate increase attributed to VTO implementations, and you're looking at order-of-magnitude shifts in purchase behavior—not incremental feature improvements.
Three psychological mechanisms explain why the numbers move this dramatically:

Want this styled from your own closet?
Elara builds the look from what you own, then lets you try it on.
- Visual proof eliminates imagination-based uncertainty. Size charts ask shoppers to picture how a measurement translates to their body. VTO shows them. That distinction collapses the single largest source of pre-purchase doubt.
- Friction reduction matters more than most retailers acknowledge. Translating a 34-inch inseam into a mental image of how trousers will drape requires cognitive effort. VTO removes that translation layer entirely.
- Ownership visualization activates what behavioral economists call the endowment effect. When a shopper sees themselves wearing something—even digitally—they begin to feel partial ownership before the transaction completes. That pre-purchase commitment significantly increases follow-through.
The return reduction data reinforces the same logic. VTO reduces return rates by 25–40%, according to research from Drezzly and Looksy. Returns aren't primarily a logistics problem—they're a confidence failure that happens at the decision stage and surfaces after delivery. VTO prevents the failure before it occurs.
The honest caveat: VTO's impact is category-dependent. For tailored pieces, dresses, and outerwear—where drape, silhouette, and proportion vary significantly—the confidence lift is substantial. For commodity categories like basic tees with standardized construction, the marginal benefit narrows. Retailers should weight their VTO investment accordingly.
The Adoption Paradox: 71% Demand, 1% Supply
The supply-demand gap in virtual try-on is one of the most striking mismatches in e-commerce right now. According to data from Morphed and ProductTryOn, 71% of consumers actively want AR try-on capability when shopping for clothing online. Approximately 1% of e-commerce stores currently offer it. That's not a modest gap—it's a near-total market failure to meet stated consumer preference.
Three barriers explain why adoption has stalled despite the demand signal:
- Upfront cost and technical debt. Building VTO requires 3D garment modeling for every SKU, AR rendering infrastructure, and ongoing maintenance as inventory turns. For a retailer with thousands of SKUs, that's a significant capital commitment before a single conversion is recorded.
- Integration complexity. Most e-commerce platforms weren't architected for VTO. Retrofitting requires engineering resources that mid-market retailers typically don't have on staff, and third-party integrations introduce their own compatibility risks.
- ROI attribution uncertainty. VTO's contribution to a sale is harder to isolate than a paid search click. Without clean attribution, finance teams default to proven channels—and VTO spend stalls in budget review.
The total cost of ownership argument, however, cuts the other direction. Size charts cost near-zero to maintain. But that near-zero cost generates substantial downstream expenses: returns processing carries meaningful costs per item, customer service load increases with fit complaints, and shoppers who receive ill-fitting items frequently don't return as customers. VTO carries higher upfront cost but dramatically lower long-term cost per satisfied customer.
The competitive implication is straightforward. The 99% of retailers not offering VTO have left a confidence-narrative advantage entirely undefended. Early adopters in any category—not just luxury or direct-to-consumer—can own that positioning before competitors recognize the opportunity. SaaS-based VTO solutions are lowering the technical barrier, but even well-implemented standalone VTO leaves a second layer of purchase uncertainty unaddressed.
Wardrobe Context: The Layer That Makes VTO Exponentially More Powerful
Standalone virtual try-on answers one question well: does this fit my body? That's a meaningful answer. But it's not the only question standing between a shopper and a confident purchase.
The second question—does this fit my life and my existing closet?—is where even well-executed VTO falls short. A shopper might feel certain a blazer fits perfectly and still abandon the cart because they can't picture what they'd wear it with. This is decision paralysis operating at a wardrobe level, not a sizing level. It's a distinct failure mode, and size charts and standalone VTO share the same blind spot: neither knows what the shopper already owns.
This is the problem Elara's wardrobe-integrated approach addresses directly. By digitizing a user's existing closet, the platform can show how a potential purchase works with what they already own—before the transaction occurs. The question shifts from "does this fit?" to "does this actually extend my wardrobe, or am I buying a third navy blazer I'll never reach for?"
The return reduction implication is significant. While VTO reduces returns by 25–40% by addressing fit uncertainty, a meaningful share of returns aren't fit failures at all—they're wardrobe compatibility failures. Shoppers return items that fit correctly but don't pair with anything they own. Virtual try-on versus size chart comparisons miss this entirely. Wardrobe-integrated VTO closes this second gap at the decision stage, the same way standalone VTO closes the fit gap.
Shoppers using virtual try-on are already 10.5 times more likely to purchase than those relying on size charts. Add wardrobe context to that confidence layer, and the hesitation that survives a successful fit visualization—but what do I wear this with?—no longer has anywhere to live.
Elara delivers this through conversational AI rather than a static widget. Recommendations surface through natural dialogue that learns preferences over time, so the wardrobe intelligence isn't buried in a secondary tool—it's part of how the platform communicates. That distinction matters: a recommendation a shopper has to hunt for is a recommendation most shoppers never find.
Head-to-Head: VTO vs. Size Charts Across Key Metrics
That wardrobe-intelligence layer represents the ceiling of what these tools can achieve. Before reaching that ceiling, though, the floor-level comparison still matters—and the numbers tell a clear story.
The return rate gap alone reframes the cost argument. Size charts require almost no investment but deliver only marginal improvement—a 5–10% reduction against a baseline problem that carries substantial cost. VTO's upfront cost looks different when weighed against a 25–40% reduction in that liability.
When size charts still make sense: Accessibility requirements (screen readers, low-bandwidth environments) favor size charts. Very small retailers without engineering resources, and categories where fit is genuinely standardized—athletic socks, basic tees in consistent fabrics—don't generate enough fit uncertainty to justify VTO investment. For everyone else, the performance gap is categorical, not marginal.
Frequently Asked Questions
Q: How much does virtual try-on cost to implement? A: Implementation costs vary widely. Standalone VTO solutions range from $5,000–$50,000+ in setup fees, depending on catalog size and platform complexity. SaaS solutions typically charge monthly subscriptions ($500–$5,000+) with per-SKU modeling costs. The total cost of ownership—including reduced returns and customer service load—often justifies the investment within 6–12 months for mid-to-large retailers.
Q: Can virtual try-on work for all clothing categories? A: VTO delivers the strongest ROI for categories where fit and drape vary significantly: dresses, tailored pieces, outerwear, and jeans. For standardized items like basic tees or socks, the confidence lift is minimal. Retailers should prioritize VTO for high-return categories first, then expand to lower-risk items as budget allows.
Q: What's the difference between virtual try-on and wardrobe-integrated styling? A: Virtual try-on answers "does this fit my body?" Wardrobe-integrated styling answers "does this work with what I already own?" VTO alone can't prevent the shopper who buys a blazer that fits perfectly but sits unworn because they can't picture outfit combinations. Wardrobe context—whether through a digital closet or conversational AI—closes that second gap at the decision stage, preventing returns driven by compatibility rather than fit.
TL;DR Summary
Virtual try-on outperforms size charts by nearly every metric: 10.5x higher purchase likelihood, 25–40% return reduction versus 5–10%, and 42% fit accuracy versus visual confirmation. Yet only ~1% of retailers offer it despite 71% of shoppers demanding it. The adoption gap reflects real implementation costs and attribution challenges, but the long-term cost per satisfied customer favors VTO. The competitive edge goes to retailers who combine VTO with wardrobe intelligence—answering not just "does this fit?" but "does this work with what I own?" Elara brings that wardrobe-integrated approach to any shopper through conversational AI, regardless of which retailer they're browsing.
Conclusion: From Comparison to Confidence Layer
Size charts set a baseline. Virtual try-on raises that baseline dramatically. Wardrobe-integrated VTO—where fit visualization meets closet intelligence—closes the gap between "this looks like it fits" and "I know exactly how I'll wear this."
Not every retailer deploys VTO overnight. The technical and financial barriers are real, and the adoption curve will be gradual. But shoppers don't have to wait for their favorite store to catch up. Elara exists precisely for this moment—bringing wardrobe-integrated styling intelligence to any shopper, regardless of which retailer they're browsing.
What separates Elara from a standard VTO widget isn't just the technology—it's the question the platform answers. Not does this fit your body? but does this work with your life, your closet, and the way you actually dress? That answer arrives through conversational AI that learns your preferences over time, not a static tool you have to remember to use.
If you're thinking about how to build genuine purchase confidence—as a shopper or as someone evaluating the tools that serve them—explore what Elara does differently at joinelara.com. The AI stylist is a good place to start.
Your stylist, in your pocket
Stop reading about outfits. Start wearing them.
Elara knows your closet, shops every store and gets you dressed for any occasion.